Capitalize on today’s evolving market dynamics.
With markets in flux, now is a good time to meet with a wealth advisor.
Key takeaways
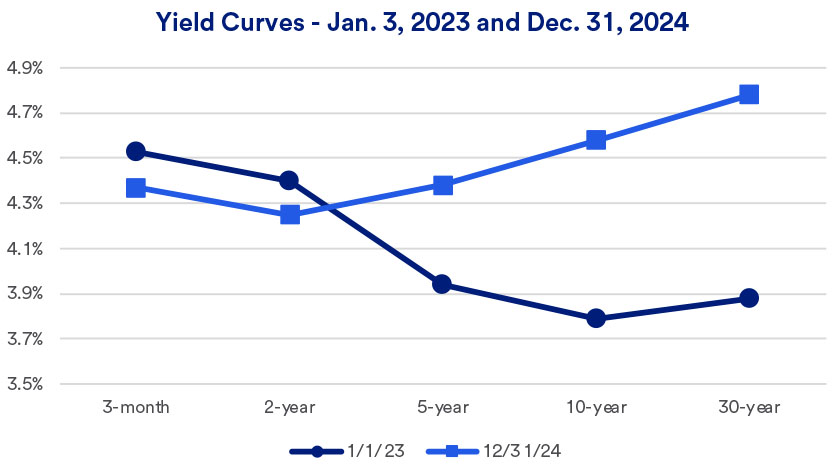
An extended Treasury yield curve inversion that started in 2022 appears to be over.
Longer-term Treasury bond yields now, as is normally the case, exceed those of short-term bonds.
Unique economic circumstances appeared to help the economy avoid a recession, even though an inverted yield curve can sometimes signal an impending recession.
From October 25, 2022 until December 13, 2024, 3-month U.S. Treasury bill yields exceeded those of 10-year U.S. Treasury notes. This extended inversion period ended approximately two months after the inversion between 2-year and 10-year Treasury yields reversed in October of last year. It represents the longest period of an inverted curve going back 45 years.1
“Given the opportunities in other parts of the market, such as global equities, investment grade bonds are likely to generate lower relative returns in the near term."
Rob Haworth, senior investment strategy director, U.S. Bank Asset Management
Beginning in 2022 and continuing into 2023, the Federal Reserve (Fed) raised the short-term federal funds target rate, an overnight lending rate used by banks that influences mortgage rates, credit card borrowing and automobile loans, by more than 5%. The Fed’s dramatic rate hikes spurred the inverted yield curve scenario. After holding rates at elevated levels for more than a year, the Fed, between September and December 2024, initiated rate cuts totaling 1%. In response to the Fed’s cuts, short-term Treasury yields declined, while long-term rates moved higher.
“It appears the inversion cycle is over for now,” says Rob Haworth, senior investment strategy director for U.S. Bank Asset Management. “Inflation expectations remain well anchored and real (after-inflation) interest rates are higher, pushing up long-term rates relative to short-term rates.” While bond yields dropped across the board, shorter-term rates fell more significantly.
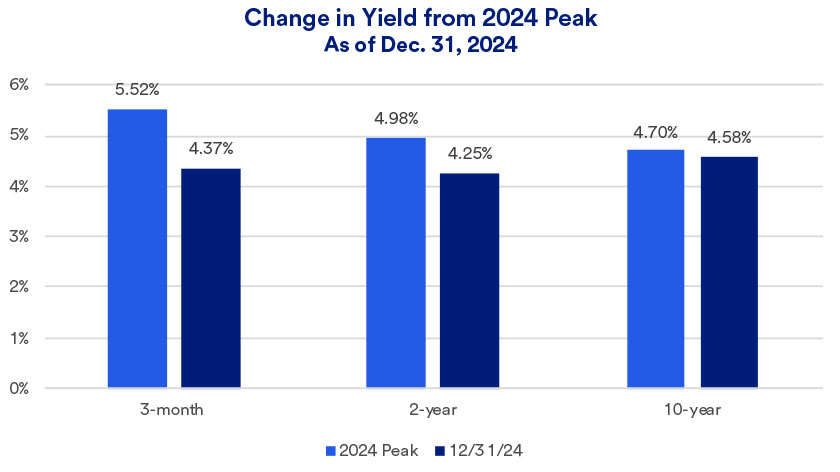
“The yield curve inversion is only likely to return if inflation resurfaces and the Fed is forced to raise short-term rates again,” says Haworth. “The Fed reducing short-term rates has a more direct impact on short-term yields,” such as 3-month Treasury bills. Haworth notes that at the same time, the Fed is reducing its own holdings of longer-term U.S. Treasuries and mortgage-backed securities.
Up until 2022, the Fed purchased Treasury and mortgage-backed securities to help maintain modest interest rates and by doing so, boost economic activity. In conjunction with raising the fed funds rate in 2022 and 2023, the Fed reduced its bond holdings. “The Fed today is maintaining an approach that, in effect, requires other investors to step in and purchase Treasury bonds,” says Haworth. “If investors are reluctant to do so, that requires the Treasury to offer higher yields to attract those dollars.” That factor contributes to today’s higher long-term Treasury yields.
The yield curve compares current interest rates, or yields, on debt securities across various maturities. Investors typically demand higher yields when investing their money for longer periods of time. This is referred to as a normal, upward sloping yield curve, as depicted below, reflecting the actual Treasury yield curve at the end of 2021.1
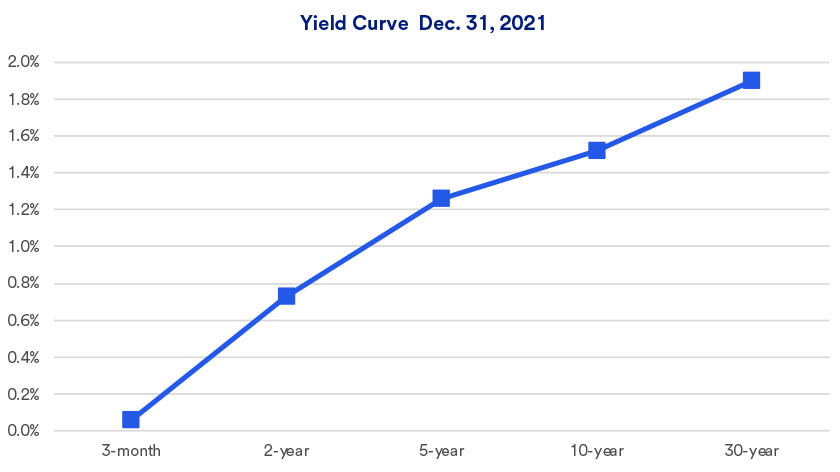
While today’s yield curve is beginning to resume a normal slope, it remains relatively flat compared to typical bond market behavior illustrated in the Dec. 31, 2021, yield curve chart.
As certainty grew regarding the likelihood of Fed rate cuts, which would lead to reduced 3-month Treasury yields, the “negative” spread between 3-month and 10-year Treasury yields quickly narrowed. In December 2024, the spread crossed a threshold and began showing a yield advantage for 10-year Treasuries, considered a more typical scenario.
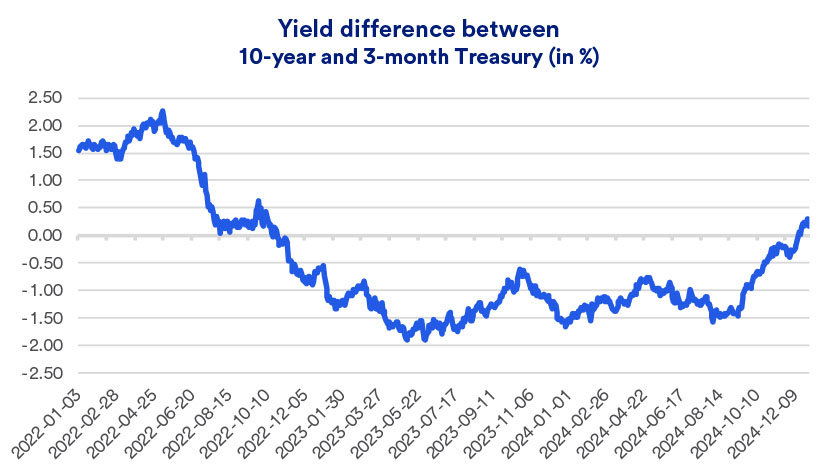
For some market observers, the onset of an inverted yield curve is considered a harbinger of an economic recession. But throughout the inverted curve period, the economy demonstrated significant strength. As measured by Gross Domestic Product (GDP), the economy grew 2.9% in 2023 and by 3% or more (annualized rate) in 2024’s second and third quarters.2 “This indicates that, at least in this cycle, the U.S. economy was less interest rate sensitive than was the case previously,” says Haworth. “Many homebuyers already locked in low mortgage rates before the Fed raised interest rates. In addition, larger corporations had sufficient financing in place, also at lower rates, so they weren’t as directly affected by the need to borrow additional dollars at higher rates.”
These factors contributed to a strong job market that helped support solid consumer spending, a key factor in ongoing economic growth.
For investors holding a diversified portfolio of equities, fixed income and real assets, Haworth says it may be time to consider modestly underweighting fixed income investments. “Given the opportunities in other parts of the market, such as global equities, investment grade bonds are likely to generate lower relative returns in the near term.”
Haworth says while a bond laddering strategy – owning bonds of different maturities and reinvesting matured bonds into longer-term debt securities over time – is a more viable option today, investors may not want to limit themselves to Treasury issues. “This is a time when taking on additional risk with lower quality bonds can pay off, as they tend to hold up well in a solid economic environment.” With certain non-taxable portfolios, this includes non-government agency issued residential mortgage-backed securities, while managing total portfolio duration using longer-maturity U.S. Treasuries. Certain tax-aware portfolios can benefit from municipal bonds, including some longer-duration and high-yield municipal securities. Trust portfolios may benefit from reinsurance as a way of capturing differentiated cash flow with low correlation to other portfolio factors such as economic trends.
Check-in with your wealth planning professional to make sure you’re comfortable with your current mix of investments and that your portfolio’s asset allocations remain consistent with your goals, risk appetite and time horizon.
A yield curve plots the interest rates paid by bonds of comparable credit quality across various maturities. A Treasury yield curve provides a comparison of government-issued bond yields of different maturities. A typical yield curve will trace current yields for Treasury debt securities with yields of three months, two years, five years, ten years and 30 years.
Typically, investors expect to earn higher yields from bonds with longer maturities. In a normal environment, the yield curve will be upward sloping. For instance, that means the yield on shorter-term bonds will be lower than the yield on longer-term bonds. However, in certain circumstances, the yield curve inverts and slopes downward. In this environment, yields on short-term securities exceed those of long-term securities. While some market observers view an inverted yield curves as harbinger of recession, that hasn’t happened in the current cycle.
The yield on a U.S. Treasury security, its effective interest rate, indicates the income that will be generated for an investor when purchasing a bond. For instance, when investing $10,000 in a 10-year U.S. Treasury note with a 4% yield, the investor will be paid income of $400 per year. Bond yields are locked in when an investor purchases a specific security, but yields paid by newly-issued U.S. Treasury securities will vary on a day-to-day basis.
With the market and economy in flux, how should investors position their portfolios to capitalize on potential opportunities, while guarding against risks?
We can partner with you to design an investment strategy that aligns with your goals and is able to weather all types of market cycles.