Capitalize on today’s evolving market dynamics.
With markets in flux, now is a good time to meet with a wealth advisor.

Key takeaways
Concerns about tariffs and their economic ramifications drove U.S. stocks into correction territory by declining 10% or more.
President Donald Trump’s decision to move ahead with sweeping tariffs is rattling capital markets.
U.S. stocks suffered the largest one-day decline since 2020 on April 3, following President Trump’s sweeping tariff announcement.
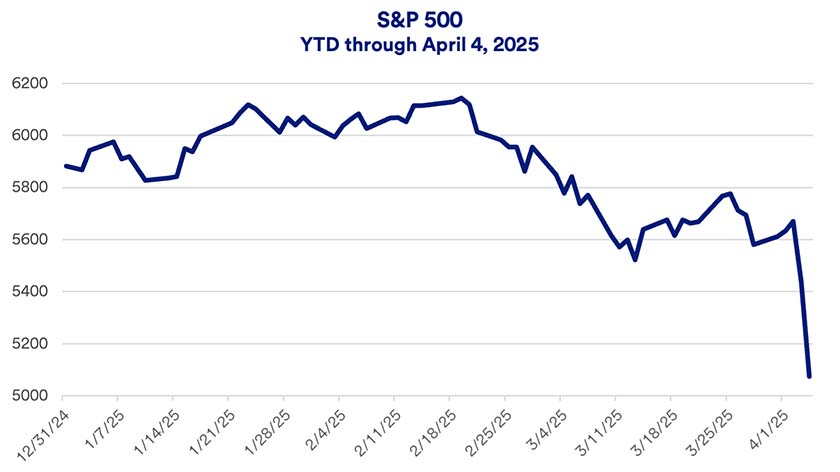
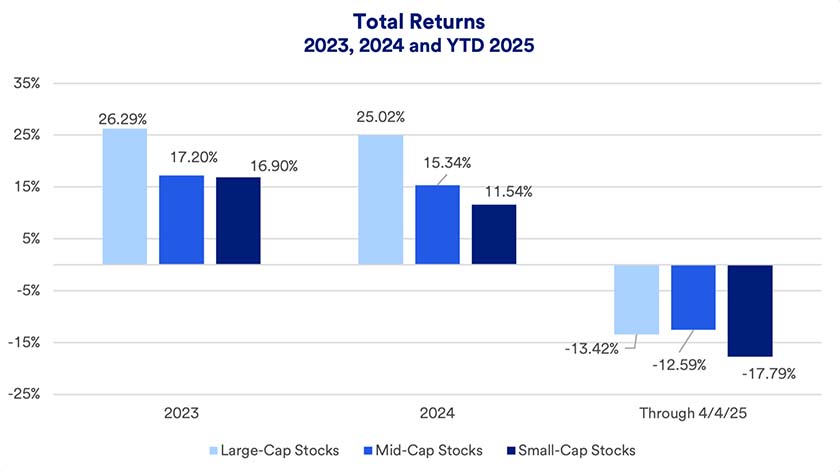
Global equity markets are in full retreat in the wake of global trade turmoil. President Donald Trump’s April 2 announcement subjecting imported goods to sweeping new tariffs prompted a swift market reaction. The S&P 500 declined more than 10% in the subsequent two trading days. U.S. stocks are now firmly in correction territory (representing a decline of 10% or more from peak values) and approaching an official bear market (a drop of 20% or more). Small-cap stocks already crossed into bear market territory. 2025’s market struggles stand in sharp contrast to the prior two years when stocks gained more than 25% each year.
Markets are reeling from rapidly evolving developments around new tariff policies, with investors weighing the ramifications. The decline in the wake of President Trump’s April 2 announcement represents the market’s most significant market downturn since 2020 when the COVID-19 pandemic first emerged.
“First, the tariffs are much higher than the market initially anticipated. Second is the expectation that this will lead to immediate cost increases, while potential benefits, such as reshoring industries and potential tax cut legislation, is farther down the road.”
Eric Freedman, chief investment officer, U.S. Bank Asset Management
“Uncertainty is the driver around the market’s recent selloff,” says Rob Haworth, senior investment strategy director for U.S. Bank Asset Management. “With President Trump laying out more detailed tariff plans, we’ll see if there’s more clarity. Up to now, the market’s consistently repricing around uncertainty.” Stocks have experienced significant volatility, particularly since mid-February when tariff talk accelerated.

While solid economic expansion and healthy corporate earnings growth drove markets until mid-February, tariffs and the resulting fallout have overtaken other market and economic fundamentals as the primary issue affecting investor sentiment. In early March, the S&P 500 first fell into correction territory. It regained some lost ground but, on April 3, reached new 2025 lows, declining further on April 4. The NASDAQ Composite Index lost more than 17% from its peak, and the small-cap Russell 2000 Index declined more than 20%, qualifying as a bear market for that segment of the stock market.1
Why have tariffs had such an impact on investor sentiment? “First, the tariffs are much higher than the market initially anticipated,” says Eric Freedman, chief investment officer of U.S. Bank Asset Management. “Second is the expectation that this will lead to immediate cost increases, while potential benefits, such as reshoring industries and potential tax cut legislation, is farther down the road.” President Trump has stated that one of his objectives in raising tariffs is encouraging more domestic goods manufacturing.
Freedman says markets to this point have been reactive without yet doing a careful fundamental assessment of how tariff policies will impact specific companies. Some analysts have warned that the new tariff policies may result in a recession.
Haworth says the full economic impact is still in question. “Consumers will likely spend at the growth rate of their income, even if spending doesn’t pick up from current levels,” says Haworth. “It’s really the strength of the labor market and the ability to continue generating income that determines if there will be a falloff in spending.” Investors are watching to see if tariffs have significant economic ramifications that could negatively impact an otherwise healthy labor market.
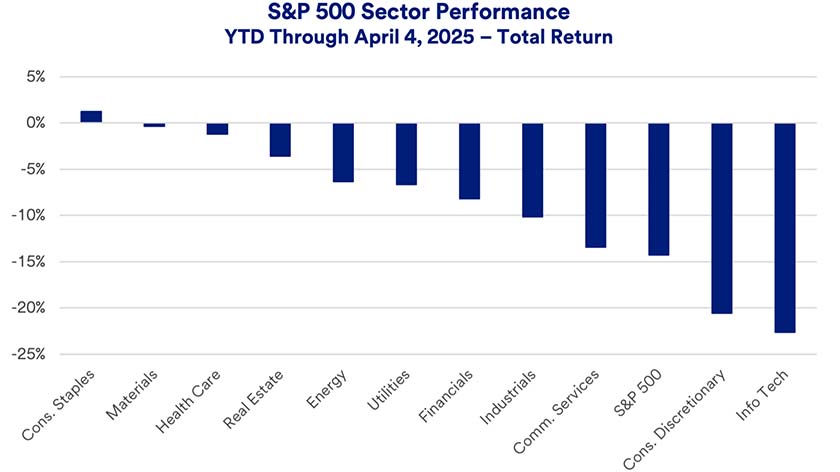
Following the market’s rapid two-day selloff last week, only one sector, consumer staples stocks, remained in positive year-to-date territory. Both information technology and consumer discretionary companies, many of which rely on overseas suppliers, have been hit particularly hard.1

The market’s recent downturn has also affected stocks of all market capitalizations, though small-cap stocks fared the worst.2

“Small companies have to survive what is, at least for now, a tougher economic environment,” says Haworth. “With the Fed holding the line on interest rates, borrowing costs remain high, and cost pressures created by tariffs will likely add to small company challenges.”
Escalating volatility is a notable market dynamic so far this year. The CBOE’s Volatility Index (VIX) is considered a critical market volatility measure. It is often referred to as the “fear index.” Haworth says the VIX rising into the 20+ range indicates weaker market sentiment. The gauge peaked above 27 just before the market fell into correction territory. After briefly retreating prior to the latest tariff announcements, the VIX Index now tops 40, a historically high number.1
Recent consumer surveys show flagging confidence. The University of Michigan’s Consumer Sentiment Index dropped 11% in March from February, and 27% below its year-ago level.3 The Conference Board’s Consumer Expectations Index is at a 12-year low while its Consumer Confidence Index declined for the fourth consecutive month.4 Recent economic concerns contrast with previously solid, economic expansion including 2023’s 2.9% Gross Domestic Product (GDP) growth and 2024’s 2.8% GDP growth.5
With consumers and businesses currently on fundamentally solid ground, at what point might current concerns related to shifting tariff policies alter economic dynamics? “If trade wars result in a higher cost of doing business, that would ultimately impact underlying fundamentals,” says Haworth. “A concern is that if the U.S. and other countries get caught up in implementing retaliatory tariffs, it could ultimately slow economic activity worldwide.”
Haworth is looking for economic clues in corporate earnings forecasts. “The market at this point is left to evaluate what multiple they should put on stocks and assess earnings expectations,” says Haworth. He notes that to date, analyst forecasts have not significantly decreased 2025 earnings expectations from previous levels, but that could change depending on the impact of tariffs.
Despite recent challenges, investors should consider the value of a diversified portfolio. For instance, with equity allocations, Haworth says, “Our position is to own a globally diversified equity portfolio, not specifically focusing on U.S. stocks or particular sectors.”
Freedman encourages investors to view markets with a long-term lens. “Stay invested, but making sure you are in the right asset allocation is essential.” Freedman recommends investors link their investment objectives to a financial plan that’s structured around key goals. In addition, says Freedman, “If you have extra cash, now is a great time to incrementally stage in some of that cash. Don’t wait for the perfect timing. It doesn’t exist.”
This is an important time to check in with a wealth planning professional to make sure you’re comfortable with your current investments and that your portfolio is structured in a manner consistent with your time horizon, risk appetite and long-term financial goals.
The S&P 500 Index consists of 500 widely traded stocks that are considered to represent the performance of the U.S. stock market in general. Diversification and asset allocation do not guarantee returns or protect against losses. The Russell MidCap Index provides investors with a benchmark for mid-sized companies. The index, which is distinct from the large-cap S&P 500, is designed to measure the performance of mid-sized companies, reflecting the distinctive risk and return characteristics of this market segment. The Russell 2000 Index refers to a stock market index that measures the performance of the 2,000 smaller companies included in the Russell 3000 Index.
Stocks are shares of publicly traded companies can be bought and sold. These transactions occur on exchanges and over-the-counter (OTC) marketplaces. The activity of pricing, buying and selling stocks is all activity that occurs in what is generally called “the stock market.”
Stocks frequently move up and down. Between November 2023 and November 2024, the stock market trended higher (following a generally downward trend between August and October 2023), except for modest setbacks in April, October and December 2024, and another negative month in February 2025.1 Solid U.S. economic growth, which helped boost corporate earnings, is still a key to ongoing market performance. New Trump administration policies, particularly those with an economic impact, are another consideration. Federal Reserve (Fed) interest rate policy can also impact markets. The Fed held the target federal funds rate at a top level of 5.50%. In September, November, and December 2024, the Fed cut interest rates a total of 1.0%, its first rates cut in more than four years. However, the Fed scaled back expectations for 2025, projecting just two additional rate cuts in the new year.7 “The Fed’s interest rate stance is a prime consideration for equity investors in today’s market,” says Haworth.
These three indices are frequently quoted on daily news reports reflecting daily performance of the stock market. The Dow Jones Industrial Average, perhaps the most quoted index, reflects the performance of 30 prominent stocks listed on U.S. exchanges. The Standard & Poor’s 500 tracks a broader universe of 500 large U.S. stocks. The NASDAQ Composite Index provides a measure of performance of 2,500 stocks listed on the National Association of Securities Dealers (NASD) Automated Quotations exchange. These represent small-, mid- and large-cap stocks. Investors often track these indices, particularly over time, to measure broader stock market performance.
1. WSJ.com
2. S&P Dow Jones Indices, FTSE Russell.
3. University of Michigan, “Survey of Consumers,” Preliminary Results for March 2025.
4. Conference Board, “US Consumer Confidence tumbled again in March,” March 25, 2025.
5. U.S. Bureau of Economic Analysis.
6. Federal Reserve Board of Governors, “Summary of Economic Projections,” released March 18, 2025.
With the market and economy in flux, how should investors position their portfolios to capitalize on potential opportunities, while guarding against risks?
We can partner with you to design an investment strategy that aligns with your goals and is able to weather all types of market cycles.