Key takeaways
Midterm elections can influence the legislative agenda of the next Congress, with the potential to impact fiscal policy, including taxation and spending priorities.
Analyzing historical data can offer insights into how midterms might affect the markets and economy.
Every four years, midterm elections for the U.S. Senate and House of Representatives have the potential to shift control of Congress. This can have a significant impact on policy, laws and foreign relations. But how do these elections affect the stock market? And how does that affect you and your investments?
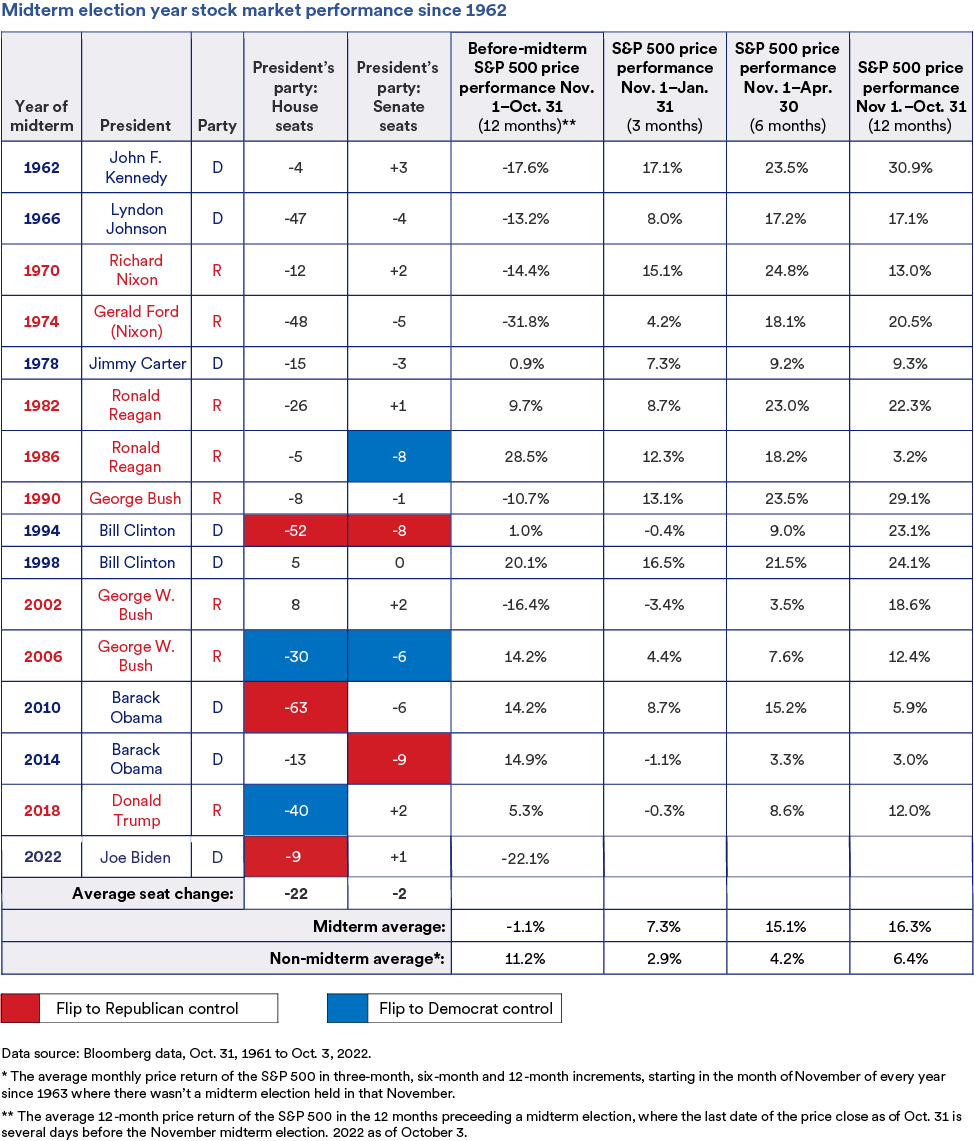
To better understand, U.S. Bank analysts studied Bloomberg market data from the past 60 years (and the 15 midterm elections held during this period) to identify midterm election cycle patterns. While past market performance is no guarantee of future results, analyzing historical data offers insights into how midterm elections might affect the market and your investment portfolio in the coming year and beyond.
Stock market performance during midterm election years can be separated into two categories: pre-midterm election and post-midterm election.
Why does the market underperform in the 12 months leading up to midterm elections and overperform the 12 months after midterm elections? One factor might be policy uncertainty. Without knowing which political party will hold majorities in Congress, it’s unclear which social and economic policies will take priority. This uncertainty resolves after the midterm election.
The problem with this theory is that the outcome of midterm elections has no noticeable impact on overall equity market performance, according to our analysis. The party or parties controlling Congress—and whether they change after a midterm election—is historically not an indicator of market performance.
Our analysis shows that the health of the economy is a much more important factor than midterm election results. The last time the S&P 500 Index produced negative returns during the 12 months after a midterm election was 1939—a time of tremendous economic contraction and uncertainty as the U.S. battled the Great Depression and World War II began in Europe.
This also explains why negative pre-midterm market returns dominated the 1960s and 1970s, pulling down the overall pre-midterm average. The late 1960s and 1970s were a time of slow economic growth marked by high unemployment, rising energy prices and significant inflation. If you exclude the five midterm elections in the 1960s and 1970s, the average S&P return for pre-midterm election years is 8.1%—roughly in line with average annual S&P 500 performance.
Since then, the economy has grown steadily, with accommodating central bank policy keeping inflation low. This suggests that a healthy overall macroeconomic environment carries greater weight than any policy uncertainty.
While it’s tempting to speculate which party or parties will control the House and Senate after any midterm elections, they shouldn’t have a significant impact on your investment portfolio or the investment strategy developed in partnership with your financial professional.
U.S. fiscal policy may change after midterms, but it’s economic fundamentals—not election results—that historically play the greatest role in equity market performance both before and after midterm elections. It’s fair to say that economic developments could factor into voter sentiment leading up to any election. History tells us that the specific election outcome, in terms of which party controls the levers of power, will not have a direct income on capital market performance.
Reach out to your wealth management professional if you have questions about your unique situation, and be sure to stay up to date on the latest market news and activity.
Explore how the stock market has fared so far under the Biden administration and what to expect moving forward.
A look at the historical performance of the markets during presidential election cycles.